Projecting Race Readiness
A unique useage of the WKO+ software is projecting what to expect on race day. Accompanying is a screen shot of a Fitness-Fatigue-Form projection for an athlete I coach who has two A-priority races in the next two weeks - the Record Challenge TT in New Mexico on September 6 and one week later the State TT Championship (click to expand). The horizontal axis represents time from the start of his training season in November of 2008 (and recovery from a crash almost immediately) until September 13, 2009.
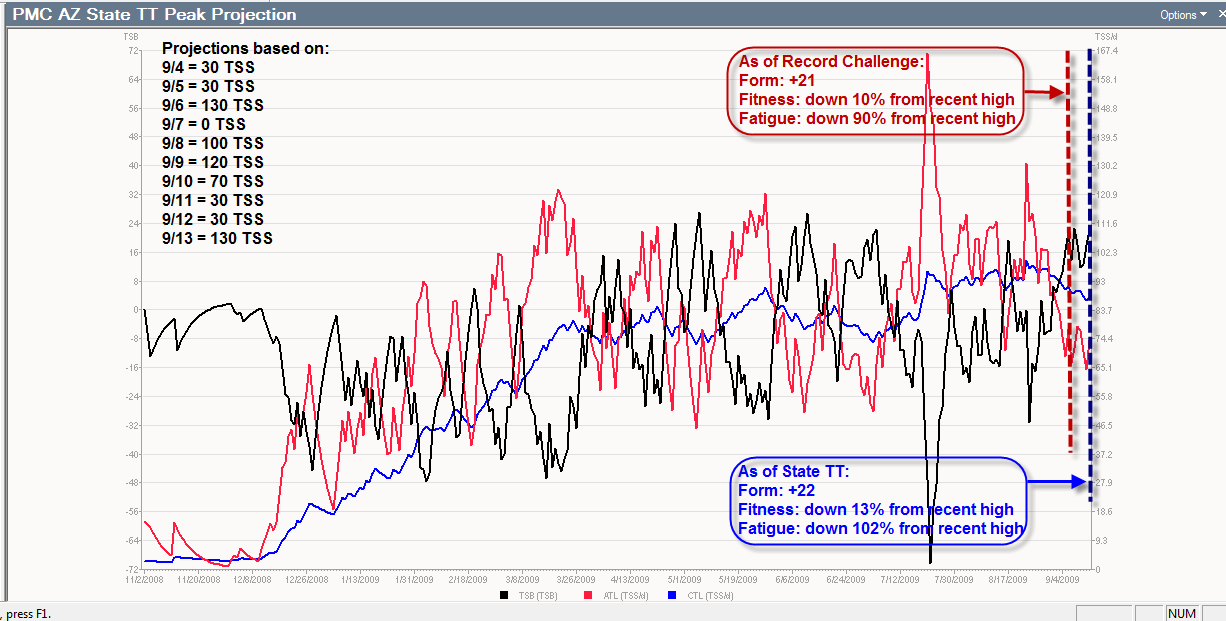 What I've done here is to determine what the daily workout Training Stress Scores (TSS) need to be during his Peak period in order to produce a Training Stress Balance ('Form') of about +20. This helped me to decide on workout intensities and durations for each day of the Peak period. You can see here that his Form worked out to +21 for the first race and +22 for the second. So just about spot on.
My other concern in projecting a Peak period is to keep Chronic Training Load ('Fitness') losses to around 10%. For the Record Challenge he will come to the race with a drop from his recent high point of about 10%. For the second race the cumulative drop will be about 13% from the same point. This is quite good also.
Should he have decided on including a third A-priority race a week after the second (he didn't) Fitness would drop even more. This helps to explain why it is so difficult to have several A-priority races in consecutive weeks. Fitness drops each week when peaking. That's because Fitness and Fatigue follow the same general trend. So when attempting to reduce Fatigue, Fitness also declines, just not as rapidly. And the longer the race is, the greater the drop. By the third or fourth week of continued Fatigue reduction, Fitness is likely to be so low that performance is significantly compromised. This is why I encourage athletes to have only about three A-priorities in a season and to space them several weeks apart, if possible. Of course, that's not always possible so you must then be aware of what the consequences may be in terms of race performance in the latter races and set goals and race strategies accordingly.
posted by Joe Friel @ 11:24 AM
14 Comments
![]()
![]()


14 Comments:
hi joe - i don't use WKO+ software yet for training but I've used your training bible to great success. I would like to understand how fatigue is derived since there are so many unquantifiable variables involved ie. each person recovers differently, amount of sleep, diet, work stress etc..
Joe,
I've been using WKO + all season, and am amazed by all the information. How do you plan workout sessions for your athletes with specific TSS scores in mind? In other words, if you want your athlete to do a ride of 130 TSS on their interval day, how would know exactly how much riding/intensity that would take?
Thanks again,
Wayne Barlow
Joe-If I am reading this correctly, you put in your athletes workouts into WKO in advance of actually performing those workouts in order to "tweak" your athlete's training loads. If so, 1) how do you estimate the workouts in advance (i.e. do you copy old wko workouts or manually enter new ones) and 2) how far in advance do you put in those workouts? Thanks,
junatik--This is a big topic and not appropriate for an answer. I need to post a blog on it some time. But the bottom line is that the more stress you cana manage, the more fit you are. A power meter can be used to measure (and graph stress). That's probably inadequate to understand the concept. But once you get a power meter and start using WKO+ you'll understand it.
HI Wayne--Great question. I have learned to estimate TSS and help the athletes I coach come to understand it. It's much like using RPE. Just a different scale. Here is the scale I use and try to get the athletes to understand and apply (the format will undoubtedly be messed up here so you'll have to do some reformatting)...
Estimating TSS based on RPE or Average Heart Rate
RPE Avg HR TSS
(1-10 scale) Zone per Hour
1 1 (low) 10
2 1 20
3 1 (high) 30
4 2(low) 40
5 2 (high) 50
6 3 60
7 4-5a 70
8 5b (low) 80
9 5b (high) 90
10 5c 100
Example 1: A 30-minute workout at an average RPE of 6 would be a TSS estimate of 30.
Example 2: A 90-minute workout at an average RPE of 4 would be a TSS estimate of 60.
Caveat: By definition, a 100 TSS workout cannot last longer than 1 hour.
Hi Coach Jen--Related to Wayne's question which I answered (somewhat sloppily with the 3 column table, I'm afraid). The bottom lines are that I try to figure out what sort of workouts (duration and itensity) result in a ballpark TSS for an athlete based on my experience in coaching them. I then just create a WKO+ PMChart with date range that ends on race day. I create workouts for each day of the peak period and 'override values' to input estimated TSS. I do this as I am creating the Peak Period training plan. It may well need to be adjusted every couple of days as you get real workouts and TSS input.
Hi Joe, where does the number 20 for TSB come from? Is that different per individual?
Joe,
Thanks for the explanation! I've done a few workouts now using your scale and have come very close to my "planned" TSS when downloading my Powertap. This is fabulous information with my first A priority race now about a month away.
Thanks again,
Wayne
Folkert--Thanks for your comment. The number 20 for TSB/form and the 10% for CTL/fitness come from experience.
Hi Joe,
I was looking at your blog and the graph. Having been through a season using WKO+ I was wondering just how fit (or in other words what standard they were at e.g 10 hour IM) that person was to build to 75TSS/d. I was doing 12-15 hours a week with 8 cycling and built to 50+ TSS/d.
Cheers
Marc
Marc--The rider here won his age category at the Ariz State TT Championship this past weekend. He's a very strong older athlete. When we first started together last winter he had been away from training and racing for many years. He has come a long way in less than a year due primarily to consistency of training. He typically rides 6 days a week and misses very few workouts (due to work and travel when they do occur). He average weekly volume over this season is probably a bit in excess of 10 hours per week with peaks around 16 hpw. Does this answer your question?
Hi Joe
Yes it does. Thanks.
Regards
For managing form for triathlon, do you manage the three sports in their respective Performance Management Charts, or is there /would it make sense to be an integrated PMC? I would think that the three sports measures are highly correlated.
folkert--I watch each in its own PM Chart. But I do watch combined ATL/fatigue in one chart.
Post a Comment
<< Home