Monday, March 31, 2008

'07-'08 Power Profiles

The accompanying chart 
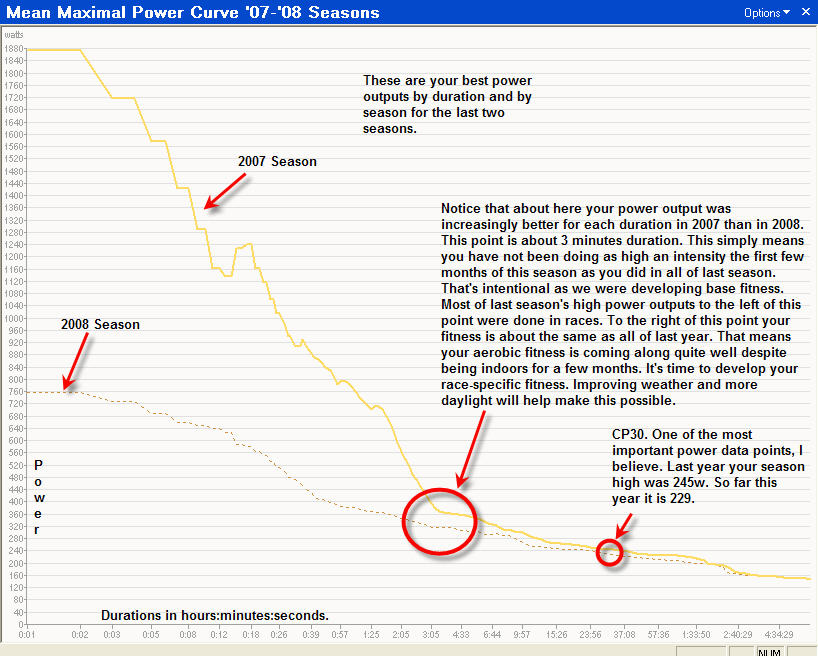
from WKO+ software shows the best Critical Power for every duration for the last two seasons for one of the athletes I coach. He is a 56-year-old who competes both as a road cyclist and triathlete. He is quite successful racing in both sports.

The solid yellow line is his 2007 season and the broken yellow line is the 2008 season as of last week. Across the horizontal X-axis are durations starting with 1 second on the left end and progressing beyond 4 hours, 34 minutes, 29 seconds (4:34:29) on the right end. The vertical Y-axis represents power. The low end is 0 watts and the high end is 1800 watts. (While a good rider, he's never done 1800w in his life or even close to it. Everything above about 1000w is random and incorrect data and should be ignored.)

Notice how at about 3 minutes the yellow lines separate. This tells me that as the duration of the effort gets shorter he was producing far greater power in 2007 than so far this year. I expect nearly all of the 2007 data points left of 3 minutes were produced in races. And since he hasn't raced yet this year and has been focused on base training elements (aerobic endurance, muscular endurance, force and speed skills) his upper end power has not been challenged. It's time to shift his training focus toward intervals with shorter work bouts of about 3 minutes or less done at his CP6 power (best power output for 6 minutes).

Also notice how the lines to the right of 3 minutes converge. As the duration gets longer his power output approaches that of last season. This suggests that his base aerobic endurance fitness is well developed and confirms that it's time to move on to the build period of training with a greater emphasis on anaerobic endurance.

Click the chart to expand it so you can read the comments which further describe what I see happening with his training this season.

Analysis tools such as WKO+ are changing the way I go about making decisions regarding how to train athletes. I'm a better coach and the athletes are faster because of such data.

Tuesday, March 25, 2008

Effect of Cycling Cadence on Running in a Triathlon

In doing some checking of the research while I was writing a magazine article on triathlon transitions I came across an interesting French study (1). The scientists wanted to see if there was an effect of bike pedal cadence on a subsequent run performance. Eight experienced triathletes completed three bike-run sessions. In each bike portion they rode at 90% of lactate threshold, which is roughly FTP, for 30 minutes. This would have been an effort similar to or slightly harder than what would be done in an Olympic-distance triathlon. They then quickly transitioned to a run to fatigue at 85% of max velocity, about the pace that would be run in a sprint-distance tri. The variable they manipulated was cadence on the bike. In the last 10 minutes of each 30-minute ride the athletes pedaled at 1) a freely chosen cadence, 2) a cadence 20% higher than #1, and 3) a cadence 20% lower than #1. So, for example, if #1 was 90 rpm then #2 was 108 rpm and #3 was 72 rpm.

What they found was that when pedaling at a cadence 20% lower than freely chosen the time to exhaustion on the run increased by 37% on average over the freely-chosen-cadence performance. Running cadence was unchanged by the cycling cadences. They also found that near the end of the low-cadence cycling bout the stress placed on the athletes' as measured by VO2, heart rate, ventilation rate and lactate accumulation were not significantly different compared with the freely chosen cadence bout. The high-cadence bout fared worse than the other two on all measures including time to exhaustion.

The study was interesting for me because it contradicted a study out of the University of Colorado from a few years ago with which I was familiar (2). Thirteen experienced triathletes completed three bike-run sessions on separate days. In each they rode 30 minutes at a high intensity and then ran a 3200-meter time trial. The only thing that changed was the cadence on the bike. As with the French study they rode one at a freely chosen cadence, a second at a cadence 20% higher than freely chosen and a third at a cadence 20% lower than freely chosen--for the entire 30 minutes (this is different than the French study in which only the last 10 minutes on the bike varied). The Buff researchers found that after cycling at a high cadence (100-110 rpm) the run times were nearly one minute faster on average than with the freely chosen bout. And, besides that, the run cadences were also quicker. Stride lengths and observed biomechanics were unchanged.

So there you have it. Take your pick: pedal at a low cadence before entering T2 or pedal at a high cadence before T2. One of them will improve your run performance. Which one? I wish I could say. I have not come across another study on this topic yet. There may be individual differences which affect the results such as your position on the bike, how steady or variable your bike pacing was, how quickly you transition, etc. If you have a personal solution for this dilemma please feel free to post it.

1. Vercruyssen, F et al. 2005. Cadence selection affects metabolic responses during cycling and subsequent running time to fatigue. Br J Sports Med 39(5):267-72.

2. Gottschall JS et al. 2002. The acute effects of prior cycling cadence on running performance and kinematics. Med Sci Sport Exerc (34(9):1518-22.

Monday, March 17, 2008

More on Pacing

Since my post last month on negative splits in steady state events such as time trials and triathlons there have been a lot of questions about how the principles described there apply to courses with hills and wind. There have been several scientific studies done on this matter. Here is a brief summary of several of these studies. I'll let you draw your own conclusions.

* Using a mathematical model Swain found that when compared with a constant effort there was a significant time savings in a cycling time trial by slightly increasing power on the uphills and into headwinds and decreasing it slightly on downhills and with tailwinds. (Swain. 1997. A model for optimizing cycling performance by varying power on hills and in wind. Med Sci Sports Exercise 29:1104-1108.)

* This study involved a review of other research such as Swain's above using a mathematical model to predict how hills and wind affect performance in a cycling time trial. The authors then revised the previous models slightly but the results were largely the same as the others: Increasing cycling power on uphills and decreasing it on downhills, and increasing power into the wind and decreasing it when riding with the wind improved time trial times significantly. (Atkinson et al. 2007. Variable versus constant power strategies during cycling time trials: prediction of time savings using an up-to-date mathematical model. J Sports Sci 25(9):1001-1009.)

* Seven male cyclists did a 16.1km (about 10 miles) time trial on a CompuTrainer 3 times each. There was a simulated 8km headwind in the first half of the ride and a simulated 8km tailwind in the second half. The pacing of the 3 rides were: a) self-selected pace, b) constant power and c) variable pacing with 5% higher power into the wind and self-selected and constant with the wind. Times were significantly faster in b and c compared with a. The fastest was c. Variable pacing based on power should be used when there is a headwind. (Atkinson and Brunskill. 2000. Pacing strategies during a cycling time trial with simulated headwinds and tailwinds. Ergonomics 43(10):1449-1460.)

* Seven cyclists did 3 time trials of 800 kilojoules each. A kiloJoule (kJ) is a measure of mechanical energy expended; 1 kcal = 4.184 kJ. Considering that an experienced and fit cyclist is about 23% efficient, this means that they were riding as intensely as they could until they expended roughly 880 kcal. For most such athletes this would take about an hour. The 3 courses and conditions were 1) flat with a self-selected power, 2) hilly with 5% grades ridden at the same constant power as course #1, and 3) same course as #2 but ridden with power varying - 5% greater than #2 on uphills and 5% lower on downills. The overall power was equivalent for all 3 courses and conditions. But the finish time was significantly faster with pacing #3. The results were: #3 - 3670 +/- 589 seconds vs. #2 - 3758 +/- 645 seconds. So varying power by 5% on hills did not significantly change the power output but saved, on average, 88 seconds in a 1-hour time trial. (Atkinson et al. 2006. Acceptability of power variation during a simulated hill time trial. Int J Sports Med 28(2):157-163.)

* So does varying power with hills and wind as suggested in the above studies cause additional physiological stress? That could be quite detrimental for a triathlete who needs to come off the bike and run. But according to Liedl et al this is not a problem. They found that variations of +/- 5% had no negative consequences for the riders' performance when compared with a constant power output. (Liedl et al. 1999. Physiological effects of constant versus variable power during endurance cycling. Med Sci Sports Exercise 31(10):1472-1477.)

* Speaking of triathletes, what is the effect of varying power on the run? A recent Aussie study addressed this issue. Eight triathletes did 2 bike-run workouts. In #1 they they rode steadily for 30 minutes at 90% of their lactate threshold power (another way of identifying FTP). In #2 they alternated +/- 20% (!) of the power they rode at in #1 every 5 minutes for a total of 30 minutes. So they did 5 minutes at FTP + 20%, 5 minutes at FTP - 20%, 5 minutes at FTP + 20%, etc. After each 30-minute ride the triathletes immediately started a run to exhaustion at 16.7 kph (about 6 minute/mile pace). The times for the run to exhaustion improved significantly after the variably paced rides. Following the steady power ride the average time to exhaustion on the run was 10 minutes, 51 seconds (10:51). After the variable-power ride the average run was 15:09 - an imporvement of nearly 50%. That's huge. However, the improvement may well have been because in #2 the last 5 minutes of the ride nefore starting the run was done at 20% below FTP. Coming off of the bike somewhat rested would have been an advantage, especially given that the power for the last 5 minutes was a whopping 20% below FTP. (Suriano et al. 2007. Variable power output during cycling improves subsequent treadmill run time to exhaustion. J Sci Med Sport 10(4):244251.)

Saturday, March 8, 2008

John Cobb Clinic

Last weekend John Cobb and I spoke at a TrainingBible Coaching camp in the Dallas area directed by Tom Rodgers. I always learn something when John speaks. As usual, there were several pearls.

John is one of the most experienced and knowledgeable people in the world when it comes to riding a bike aerodynamically. He spends countless hours in wind tunnels every year testing equipment and rider positions and has been doing this since 1984. He is also the brains behind equipment design for Blackwell Research. John may be best known for his work in helping Greg LeMond and Lance Armstrong with their equipment designs and positions on the bike when at the heights of their careers.

At the Texas camp John talked about several aerodynamics issues. The one that especially grabbed my attention was helmets. He said he had spent $11,000 recently buying time in a wind tunnel trying to determine the best helmets for various shoulder and back positions when time trialing or racing triathlon. What he found was that there was no relationship between aerodynamic helmet design and body position. There were a few lessons learned, however. Any aero helmet was ‘faster’ than any road helmet when in the aero position. But here’s the one that blew me away: Aero helmets are more aero when the tail is sticking up in the air (face looking down) than when the tail of the helmet is against the back. I’ve always believed just the opposite as it seems logical. I even wrote a blog on this last year.

But there was a caveat in John’s message. The reason why they are more aero when the helmet tail is pointing up has nothing to do with the tail of the helmet; it has to do with the air vents on the front. When the tail of the helmet is against the back and the rider is looking ahead the front air vents create a lot of turbulence which increases drag. When looking down so that the tail is raised the air flows around the helmet more smoothly since the vents aren’t exposed to the wind. So if you tape over the air vents the helmet creates much less drag and you go faster. But then you run the risk of overheating in a long race. I didn’t ask, but I logically assume (dare I do that again?) that with the vents taped the helmet is faster with the tail down than up. I’ll ask next time I see John.


To keep up with the latest in aero research visit John's blog.

Sunday, March 2, 2008

Coaching Has Changed

When I started coaching endurance athletes in 1980 training was pretty simple. It didn’t take much to be a coach. The technology consisted of a stopwatch, a telephone and a postage stamp. Everybody I coached lived within 15 miles of me. Coaching was pretty much a guessing game since there wasn’t much training data. The athletes would tell me how training had been going in our weekly conversations and from that I’d design the next weeks’ training programs and mail it to them.

In 1983 I got my first heart rate monitor, a Polar which I still have, and began to slowly figure out how to use it. By 1986 I required everyone I coached to have one. Some balked at this at first but they eventually went along with me and began to see the benefits of “high tech” training. A couple of years later I got a fax machine which made it much easier to get training programs to athletes I coached and for them to get their training logs to me. Every Monday morning my office desk would be covered with rolled-up, heat sensitive, fax paper copies of their logs for the previous week.

By 1989 my clientele began to expand outside of Northern Colorado where I lived at the time. In the early 1990s I had clients in Wyoming, Arizona, California, New York City, Florida, British Columbia, and the Cayman Islands. Communication was becoming a major issue in coaching. But fortunately, about this time email came along and athlete-coach communication improved considerably. I was still guessing at what to have the athlete do in training, though. I was only slightly more affective than I had been 10 years earlier.

In 1995 I got my first power meter—an SRM that was loaned to me for three months by Uli Schoberer, the inventor of the SRM a few years earlier. I had heard about Greg LeMond using an SRM in the last year or so of his career and I was intrigued by the concept without really knowing much about it. By the end of that summer I was thoroughly convinced that power was the future of bike training. But I couldn’t afford to buy one. Then in 1998 I got a call from a mechanical engineer in Massachusetts. He had invented something and wanted to fly to Colorado to show it to me. It was the PowerTap power meter. He gave me one of the first prototypes and so I was back to training with power again. And it’s been that way ever since.

Shortly after I began requiring all of the athletes I coached to have power meters. Some balked at it as it was too “high tech.” Most believed a heart rate monitor was all that was needed (how things had changed!). Each soon learned the benefits of training with power and became completely sold on it. Podium results have a way of doing that.

About that same time—1992, I believe—Timex, and later Garmin, came out with GPS devices for runners. The benefits of GPS were obvious once I tried it out. That soon became a requirement for my triathletes, also. But now I was becoming overwhelmed with data.

Around 2004 I found out about Cycling Peaks software (now known as WKO+™). For the first time I was able to thoroughly interpret power and heart rate data. This was based largely on the ideas of Andy Coggan, PhD, who developed the Training Stress Score (TSS) concept which allowed a much more in-depth analysis of power data. More recently running TSS has made it possible to analyze running with WKO+ the same way as with power. TSS challenged the training methodology I had been using now for 20-some years causing me to rethink, and in some cases modify, how I trained athletes and even what I thought I knew about training. The learning curve has been steep the last two years because of TSS.

My business partners and associates at
www.trainingpeaks.com are working on more technology now which will soon make me more effective as a coach and allow my athletes to race even better. The stuff they tell me they are developing is pretty exciting. I can’t wait!

Now I look back at the 1980s and wonder how I ever did it. I was shooting from the hip all the time. Back then athlete-coach proximity was the key to successful coaching. It no longer is. I don’t care where the athletes live any more so long as they speak English, are experienced and have good skills. The issue is now technology and data analysis. The more data I get from the athlete the better. Coaching has certainly changed.