Thursday, December 17, 2009

Force Training

In the last several posts I've described various aspects of Base-period training including aerobic endurance, speed skills for cycling, and speed skills for running. Now I'd like to discuss a third Base-period ability - force.

The main message here is this: Endurance athletes who are deficient in force will never fully realize their capacity to swim, bike or run fast because they lack power. You also need power to climb hills and plow through rough water. Having a good level of force, the ability to overcome resistance (such as gravity or drag), is a critical aspect of power. Let’s examine power from a physics perspective and then tie it into our world of endurance sport.

In physics, power is defined as work divided by time. I’m sure you know what time is, but what is “work”? Work is force multiplied by the distance moved. Huh? Ok, let’s try to get a handle on this by thinking about riding your bike.

If you choose a high gear, something such as 53t x 14t, the bike travels a relatively long distance on every, single revolution of the pedals. Had you chosen a lower gear such as 39t x 18t the bike would not go as far on one turn of the cranks. So a higher gear means a greater distance traveled. That’s the “distance moved” part of the power equation.

If you are in that high gear it takes a lot of muscular force to drive the pedal down. That should be obvious. When you are in a 53t x 14t you have to push harder than when you’re in a 39t x 18t. (This, of course, assumes a lot of things such as you are on the same section of road with the same wind both times.) That’s a second part of the power equation – “force.”

The last part is “time.” This is how long it takes you to turn the pedals through one, complete revolution – from the 12-o’clock position back to 12-o’clock. A high cadence means you are turning the cranks fast so the time of one revolution is brief. A low cadence means the revolution time is long.

So the application of this equation is that the way to have great power on the bike is to have the capacity to drive a big gear at a high cadence. It’s the same for swimming and running only now we are talking about stroke or stride length instead of gear size. The bottom line is that you can go faster by increasing force or distance – or both. You can also go faster by decreasing time. This means a higher cadence, or higher stroke or stride rate. I explained stride rate in the last post on running speed skills. Any of these three changes will make you faster. In the next post (when I get some time again - more travel on the way) I will introduce the process I use to improve force in order to help the athletes I coach become more powerful. The key to force is greater strength in the muscles that you use in your sport.

Here's the short message for where I am going with this: There are two training routes to improving your muscles’ ability to produce force. The first is resistance training in the gym. The other is the sport-specific development of force while swimming, biking or running. I like to have athletes start with a short, resistance-training phase in the early Base period and then switch over to sport-specific training in the mid-Base period while maintaining the gains made in the weight room. While resistance training is not the same thing as swimming, biking and running, it gets your muscles ready for the sport-specific phase which is where the greatest gains are eventually made.


I hope to follow up on this with details in a few days. Check back soon.

Labels: , , ,

Thursday, November 26, 2009

A Quick Guide to Setting Zones

I returned home from Oslo last night and seem to be very close to the Mountain Time Zone already. Traveling west is so much easier than traveling east. But that's not the topic for this post. Perhaps at another time. Now is when most northern hemisphere athletes are thinking about setting their training zones for the Base period. And since I tend to get a lot of questions about how to do that it's a good time to explain the process for heart rate, power and pace.

This Quick Guide will help you get the intensity of your workouts dialed in for your heart rate monitor, power meter, and runner’s speed and distance device such as a GPS or accelerometer. Swimming pace is also described here.

For a more complete guide to training with heart rate, power and pace please see my book Total Heart Rate Training. You will also find more detailed information on the subject of measuring intensity in my Triathlete’s Training Bible, Cyclist’s Training Bible and Mountain Biker’s Training Bible books. Feel free to share this Quick Guide with your training partners.

Setting Heart Rate Zones (Running and Cycling)
Step 1. Determine your lactate threshold heart rate (LTHR) with a short test. (Do not use 220 minus your age to find max heart rate as this is as likely to be wrong as right. This is explained in detail in Total Heart Rate Training.) This LTHR test is best done early in the Base and Build periods.

To find your LTHR do a 30-minute time trial all by yourself (no training partners and not in a race). Again, it should be done as if it was a race for the entire 30 minutes. But at 10 minutes into the test click the lap button on your heart rate monitor. When done look to see what your average heart rate was for the last 20 minutes. That number is an approximation of your LTHR.

Note: I am frequently asked if you should go hard for the first 10 minutes. The answer is yes. Go hard for the entire 30 minutes. But be aware that most people doing this test go too hard the first few minutes and then gradually slow down for the remainder. That will give you inaccurate results. The more times you do this test the more accurate your LTHR is likely to become as you will learn to pace yourself better at the start.

Step 2. Establish your training zones. Use the following guide to establish each zone by sport.

Run Zones
Zone 1 Less than 85% of LTHR
Zone 2 85% to 89% of LTHR
Zone 3 90% to 94% of LTHR
Zone 4 95% to 99% of LTHR
Zone 5a 100% to 102% of LTHR
Zone 5b 103% to 106% of LTHR
Zone 5c More than 106% of LTHR

Bike Zones
Zone 1 Less than 81% of LTHR
Zone 2 81% to 89% of LTHR
Zone 3 90% to 93% of LTHR
Zone 4 94% to 99% of LTHR
Zone 5a 100% to 102% of LTHR
Zone 5b 103% to 106% of LTHR
Zone 5c More than 106% of LTHR

Step 3. When following the heart rate-zone directions in my training plans or the workouts in the appendices of my books or my workouts in the menu of workouts at TrainingPeaks use the zones as established above.

Setting Power Zones (Cycling)
Step 1. Establish your Functional Threshold Power (FTPw). Use the same 30-minute time trial test above for LTHR to determine your FTPw. The only difference is that the average power for the entire 30 minutes is an approximation of your FTPw (not the last 20 minutes). This may be done on the road or on an indoor trainer. The road will generally give better results so long as it is relatively flat and free of stop signs and heavy traffic. (Keep your head up. Time trialing with your head down is very dangerous. I have a friend who is in a wheelchair now because of this.)

As with LTHR testing, the more times you do this test the more accurate the results will become since there is a learning curve associated with such an effort. This is best done early in the Base period and then every 4 to 6 weeks thereafter. The more times you do this test the more accurate your FTPw will become.

Step 2. Set up your personal power training zones using the following guide (from Allen and Coggan, Training and Racing With a Power Meter).

Zone 1 Less than 55% of FTPw
Zone 2 55% to 74% of FTPw
Zone 3 75% to 89% of FTPw
Zone 4 90% to 104% of FTPw
Zone 5 105% to 120% of FTPw
Zone 6 More than 120% of FTPw

Step 3. When following the power-zone directions in my training plans or workouts in the appendices of my books use your zones as established above.

Setting Pace Zones (Running)
Step 1. Determine your Functional Threshold Pace (FTPa) using either a runner’s GPS device or an accelerometer. To do this, warm up and then run for 30 minutes just as described under “Setting Heart Rate Zones, Step 1” above. Your FTPa is your average pace for the entire 30 minutes (not the last 20 minutes). This is best done early in the Base period and then every 4 to 6 weeks thereafter. The more times you do this test the more accurate your FTPa will become.

Step 2. Compute your pace zones with the following guidelines using your pace as minutes and seconds per mile or kilometer. It is easier to work with this if you convert seconds to tenths of a minute (or work entirely in seconds). For example, 7 minutes 30 second would be 7.5 minutes (or 450 seconds).

Zone 1 Slower than 129% of FTPa
Zone 2 114% to 129% of FTPa
Zone 3 106% to 113% of FTPa
Zone 4 99% to 105% of FTPa
Zone 5a 97% to 100% of FTPa
Zone 5b 90% to 96% of FTPa
Zone 5c Faster than 90% of FTPa

Step 3. When following the run pace-zone directions in my training plans or my book workouts or from my workouts in the menu at TrainingPeaks use your zones as established above.

Swimming Pace
Step 1. Determine your T-time. There are many ways of doing this. One of the most common is to swim a 1000-meter/yard time trial at your pool. It may help to have someone on deck counting laps as it’s easy to lose track in such a test. What you are trying to determine is your average 100 pace for the test. Simply swim 1000 and then divide your finish time by 10. This is your T-time. This should be done early in the Base period and every 4 to 6 weeks thereafter. The more times you do this test the more accurate your T-time will become as there is a learning curve that has to do with pacing in the first few minutes when doing this test.

Step 2. In my training plans, book workouts (in The Triathlete’s Training Bible) and in the workout menu of TrainingPeaks the swim workouts will often refer to pace as T-time plus (+) or minus (-) a few seconds. For example, T-time + 5 seconds would mean swimming at a pace that would be the equivalent of your T-time plus 5 seconds. So if your T-time is 91 seconds this workout would be calling for you to swim at 96 seconds per 100. If it is a 50 meter/yard set you are doing, the time you are shooting for is 48 seconds (half of 96). In the same way, if the set calls for you to swim 150 meters/yards at T-time + 5 you would swim the distance in 2 minutes and 24 seconds (96 sec + 48 sec).

Labels: , , ,

Sunday, November 22, 2009

Stress-Based Training

I've been traveling a lot this month including 10 days vacationing in the Caribbean. I'm now in Norway with some time to kill after speaking to a large group of athletes on Saturday. So I've been thinking a lot. The following is something which grew out of having a lot of uninterrupted thinking time.

Training for racing is all about adapting to stress. Pushing yourself to the limits of your abilities in a race is highly stressful. This stress comes in the form of some combination of intensity, duration and perhaps frequency. For example, the duration of a 20km cycling time trial is relatively brief, but the intensity is quite high. A 5km running race has a similar distribution of intensity and duration. Heart rate and perceived exertion are near their upper-end limits in both types of racing. In an Ironman triathlon, however, the duration is quite high while the intensity is quite low. That's another kind of stress. A cyclist competing in a stage race has a third variable with which to be concerned – frequency. This could take the form of two stages in a day or stages on consecutive days. The combination of intensity, duration and frequency is what makes events such as the Tour de France so challenging.

We can measure and quantify stress if we know duration and intensity (we’ll mostly ignore frequency for now). It’s easy for duration. Just use a stopwatch to determine how many minutes you exercised. Frequency is also simple. Count the number of races or workouts completed in a given number of days.

Intensity is more challenging. Endurance athletes are not very good when it comes to expressing how intense a race or workout was. The most basic way, the one athletes have been using for as long as there has been competition, is perceived exertion. “That was a hard race,” always means the same thing - intensity was high relative to the duration. In a similar way athletes typically use terms such as “easy” or “moderate” to describe intensity when compared with duration. But since this is al somewhat vague, ratings of perceived exertion (RPE) have been used to quantify the intensity-duration combination. The most popular systems were developed by Gunnar Borg. Here is his 10-point scale [1]:

RPE Zone - Level of Exertion
0 - NOTHING AT ALL
0.5 - VERY, VERY LIGHT
1 - VERY LIGHT
2 - FAIRLY LIGHT
3 - MODERATE
4 - SOMEWHAT HARD
5 - HARD
6
7 - VERY HARD
8
9
10 - VERY VERY HARD (MAXIMAL)

About 30 years ago the heart rate monitor was invented. By the late 1980s heart rate zones were being used to express intensity. For example, in the system I’ve been using for the last 20 years there are seven zones based on a percentage of your lactate threshold heart rate which can be found with a 30-minute time trial [2]:

HR Zone* - % Lactate Threshold
1 - less than 0.81
2 - 0.81-0.89
3 - 0.90-0.93
4 - 0.94-0.99
5 - 1.0-1.02
6 - 1.03-1.05
7 - more than 1.05
For the purpose of this discussion I've changed my normal normal zone titles for the anaerobic zones: 5a zone to "5," 5b to "6," and 5c to "7." You'll see why shortly.

For cycling, intensity may also be quantified with zones using a power meter in a way which is similar to heart rate zones. In this case the reference point is something called Functional Threshold Power (FTPw) which is very similar to lactate threshold. This also may be found with a 30-minute time trial. Then by using percentages of FTPw power zones are established that are unique to you.

Power Zone - % FTPw
1 - less than 0.56
2 - 0.56-0.75
3 - 0.76-0.90
4 - 0.91-1.05
5 - 1.06-1.20
6 - 1.21-1.50
7 - more than 1.50

Using the idea of FTP, running zones based on pace may also be determined. Only in this case “FTPa” stands for Functional Threshold Pace [4] and found by - you guessed it - a 30-minute time trial.

Pace Zone* - % FTPa
1 - greater than 1.29
2 - 1.29-1.14
3 - 1.15-1.06
4 - 1.05-1.01
5 - 1.00-0.97
6 - 0.98-0.90
7 - less than 0.90

Besides simply expressing intensity of a workout at any given time, these RPE, heart rate, power and pace intensity zones can be used to determine how long and how intense the key “breakthrough” workouts need to be to prepare you for stress of the competition. This is based on what the race will be like in terms of stress. Given some experience in racing you should be able to estimate what the stress of your race will be. For example, if you are doing a 90-minute, steady-state bike race that will be conducted entirely in zone 4 (using whichever system from above you prefer) then the stress of that race could be expressed as a "training stress score" (TSS) of 360 (90 x 4).

Now that you know the stress demand of the race the next step is to determine the key breakthrough workouts to prepare you for the race. In the early to mid-Base periods those workouts would involve low intensities, especially zone 2. So to do a 360 TSS workout in the first half of the Base period you could train for 180 minutes at zone 2 (180 x 2 = 360). This is a grea way to improve aerobic endurance.

By the late Base period you would be training with more zone 3 time so this would require 120 minutes (3 x 120 = 360). But by this stage it is wise to break the workout into intervals since this duration-intensity combination is becoming exceptionaly demanding. So if you did 165 minutes (2:45) including 5 x 20 minutes at zone 3 (300 TSS) with 4 x 5-minute recoveries in zone 1 (20 TSS), a 30-minute warm up with half in zone 1 and half in zone 2 (45 TSS), and a 15-minute cool down (15 TSS) you would again create a 360 TSS workout. Excellent muscular endurance trainng as you normaly should be doing at this time in the season.

In the Build period interval training would again be the way to go. And since we want the workouts to become increasingly like the race these intervals would be done in zone 4. A 367-TSS workout (a little over our 360 but not by much) may then look like this.

30-minute warm-up with half in z1 and half in z2 (45 TSS)
9 x 8-minute work intervals in z4 (288 TSS)
8 x 3-minute recovery intervals in z1 (24 TSS)
10-minute cool down (10 TSS)

You wouldn't want to do a workout like this too often. It's very hard. Probably no more than once every week or two would be best. This would depend on how stressful the workout must be to prepare you for the race and what your fitness is like at the time. Runners would also have to take into consideration the potential of injury from long and intense workout combinations.

This is a lot of work but it may be a way of getting you prepared for the stress of your race. You can do all of this or you can simply use WKO+ software (http://home.trainingpeaks.com/wko-desktop-software/analysis-software-for-training-files.aspx) with your power meter and/or accelerometer and GPS device. This software automatically determines a Training Stress Score (TSS) for each workout. You can also use this software to estimate the TSS of your races. This is what I do. Much simpler. And very effective.

References
1. Borg, GAV. Borg’s Rating of Perceived Exertion and Pain Scales. Champaign, IL: Human Kinetics, 1998.
2. Friel, J. The Cyclist’s Training Bible. Boulder, CO: VeloPress, 1996.
3. Allen, H. and A. Coggan. Training and Racing With a Power Meter. Boulder, CO: VeloPress, 2006.
4. Friel, J. The Triathlete’s Training Bible. Boulder, CO: VeloPress, 1998

Labels: , , , , , ,

Tuesday, November 17, 2009

Coaching Novice Athletes, Part 5

It's been a busy November. I'm back in Scottsdale after 10 days on vacation in the Caribbean. On Thursday I leave for Oslo and will be gone a week so hope to finish this series on training for novice athletes before that trip.

This part has to do with the fifth ability (of six). Again, I am discussing these abilities in the order in which I introduce them into the novice's training program. For greater detail you can pick up a copy of one of my Training Bible books.

5. Power. This ability is of primary concern to the cyclist and of little concern to the triathlete. For the experienced cyclist and perhaps for the advanced triathlete I may introduce power training sometime in the middle of the Base period. It's important for road cyclists since race outcomes are often determined by a sprint, and criterium racing is essentially a seemingly endless string of sprints. This type of training may even be beneficial for high-level triathletes as it has been shown to improve overall power at lower intensities. But since it places great stress on joints I don't include it in the training of novice triathletes and I hold off on introducing it into the training program of novice cyclists until the Build period.

Before power workouts are introduced it's best that the rider's force and speed skills (especially sprinting skills) are well-established. Power workouts combine high levels of force with the turning of big gears along with a high cadence. A heart rate monitor is of no value to this type of training. Using a power meter is ideal, however, since what we are after is achieving a high power output as quickly as posssible.

There are many different power workouts. My favorite is "12-stroke sprints." After a long warm-up and a few form sprints the rider does a maximal-effort sprint. This may be done on a low-grade hill or flat terrain. Count every time the right (or left) foot drives the pedal down. On the 12th stroke the sprint ends. The purpose is to see how great of a power output can be generated in 12 strokes (or less).

Doing these the rider learns to keep weight distributed fairly evenly between the wheels when standing with a low profile by keeping the butt over the nose of the saddle while selecting the right gear for the terrain and effort.

After a 3- to 5-minute recovery the second sprint is done just as with the first. Sprints may continue with long recoveries until there is an obvious decline in power output. These may be done in sets of 3 to 5 sprints with very long recoveries (10 minutes or more) between sets.

This may also be included at the start of another workout such as muscular endurance or aerobic endurance. In the Build period the sprint portion of the workout is often shifted to the end of the workout to better simulate the stresses of road racing.

I hope to post the last part in the next two days depending on how much work I need to get done before my next trip.

Labels: ,

Thursday, September 3, 2009

Functional Threshold

Someone asked on my Twitter feed today what ‘FTP’ is. I had recently mentioned it in a tweet. Since I use that term a lot it’s probably a good idea to define it. A little background first…

Anaerobic threshold. Lactate threshold. Ventilatory threshold. These are terms used to describe points in the intensity spectrum when the athlete is on the verge of or is already accumulating lactate and hydrogen ions in the body’s fluids. This means that the body is rapidly becoming acidic. Scientists attempt to define the above terms very precisely and see each as having unique conditions. Despite their best efforts even they fail to be in complete agreement on what each means.


As athletes we seldom get involved in such discussions. We tend to see these terms as interchangeable and meaning roughly the same thing – you are “redlining.” And for all intents and purposes, that is reasonable since these thresholds occur at roughly the same point and are seldom exactly the same from one day to the next due to variations in fitness and fatigue.

Magazines and books written for the athletic market use these terms when talking about training for endurance sports, also often interchangeably. So we have come to accept and generally understand what they mean, especially 'anaerobic' and 'lactate' threshold. They are less clear on 'ventilatory' threshold since this term is used much less frequently than the other two. In fact, you can simply use the word 'threshold' when speaking with other athletes and they will usually take that to mean a high effort with an RPE of about 7 or 8 on a 10 scale.

Now there is a new term being used to describe this level of intensity – 'functional' threshold. This is largely due to the work of Andrew Coggan, PhD, and Hunter Allen and their book, Training and Racing with a Power Meter (VeloPress, 2006). I like this term for field work because it removes all of the mystery associated with scientific concepts such as hydrogen build up, lactic acid, lactate, aerobic, anaerobic, RER, ventilatory rates, and the like. Very few really understand these terms. Functional threshold solves this problem by defining redlining based on actual output in a field test or race.

Functional threshold power or pace (FTP) is the highest mean average power or pace you can maintain for one hour. That’s quite precise, clear and logical. It even fits nicely with what we know about AT, LT, and VT. When you are in good shape these various measures of intensity can be maintained for about an hour. So rather than trying to describe this phenomenon with biological conditions, we simply define it based on a common output denominator.

Once you know FTP your training zones may be established based on power or pace. WKO+ software does this for you. All you do is plug in your FT power (cycling) or pace (running) and the zones are automatically calculated. Then workout intensity is determined based on pace or power zones. WKO+ will also determine heart rate zones using the system described in my books. Just enter your average heart rate for a one-hour race effort. Of course, this software goes well beyond simply setting zones. It also allows you to see a visual representation of the pace- or power-based workout and graph the workout/race data into several different charts for analysis.

All of this analysis data is based on FTP so it must be kept updated with periodic testing to make sure you have it right. Over the course of a season FTP will change a lot if your training is affective. And it is one of the best indicators of how your fitness and race readiness are progressing. While heart rate remains rather steady throughout the season, power and pace change considerably. That’s obvious since becoming more fit provides several benefits including being faster and more powerful. Training is all about accomplishing these goals. That’s why I keep a close watch on FTP for the athletes I coach and highly recommend that self-coached athletes do the same.

Labels: , , ,

Thursday, October 23, 2008

Llanos Power Hawaii 2008

Here you can see the 2008 Hawaii Ironman power chart for 2nd-place Eneko Llanos. This is from his Power-Tap and found on the Saris website (http://www.saris.com/athletes/PermaLink,guid,983fb23f-1a03-4315-b652-dc71e448b4cd.aspx). The Saris website also offers a summary of his data by quarters in the race. His bike split was 4:33:27, the 6th fastest on the day. 
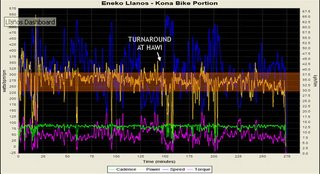
The chart is a bit hard to read. The only part that really tells us anything here is the power graph, the yellowish line across the middle. Unfortunately, there was no heart rate data.

What you see here is fairly typical of the pro race among those with the top bike times each year. In the first 20 minutes there is a lot of power variability. Lots of peaks and valleys. He is probably quite excited at this stage of the race having come out of the water in eighth place three minutes back from the leaders. So he was undoubtedly working his way up toward them. Being with the lead group is quite an advantage. This may be partially mental as well as physical. Mental because it seems easier to ride hard when there are others nearby. Riding alone makes it very difficult to keep pushing. And even maintaining a staggered gap on the riders ahead within the rules may still afford some drafting benefit if the wind conditions are right. A group of riders going down the road, even though spread out, can displace and redirect a lot of wind.

Note that power for the first half of the race is fairly steady once beyond those initial 20 minutes spent looping through Kona with several turns. His average power for each of the first two quarters of the bike leg was 286 and 284 watts, respectively. Around the half-way point power begins to fade a bit. In the third quarter he averaged 260 watts and 251 in the fourth quarter. This, again, is typical for the pro race. Llanos is paying the price for having gone out so fast early on. He faded less than many of the others since he split the bike in fifth place among the pro field.

Allowing power to fade a bit may also have to do with anticipating the run. He would like to have something left in his legs now that he’s established his position in the field. And this tactic paid off as he ran a 2:51:49 marathon, the tenth fastest of the day. With a tenth-best run I would not have normally expected him to take second. But that day the early leaders on the bike faded significantly. In fact, among the pro men, of the top 10 fastest bike splits only four made the top 10 overall. Six of the top 10 overall finishers were well outside the top 10 fastest bike splits. For example, ninth-place-overall Michael Lovato had the 25th fastest ride of the day (4:45:21). (Some day I’ll write on this. I once looked at what was the best predictor of a high finish place in various Ironman races. In Hawaii it was clearly the run.)

With an average power of 270 watts and a weight of 72 kilograms (158 pounds) Llanos’ average power-to-weight ratio for the ride was 3.75 w/kg (1.71 w/lb). As you can imagine, that’s quite good for riding 112 miles.

While effective for Llanos and a few others in Kona this year, I would not recommend this way of Ironman racing for most amateurs. First, amateurs are likely to have several other riders near them regardless of how hard they work. In Hawi we saw only a few amateurs riding with no one else nearby. The pros train to race this way – or at least they should. Most amateurs do steady state rides for their longest bike workouts. You should always race the way you train. But given that there is a 15-minute gap between the start of the pros and the age groupers, the amateur leaders out of the water who are contending for a high overall and age-group placement may well want to race much as the pros do. There are very few of these in the race, however.

The average watts per kilogram for the other amateurs should probably be in the range of 2.9 to 3.3 w/kg (1.3-1.5 w/lb). And that’s only for the young males. For every year beyond the age of 35 subtract a half percentage point. Women can lower that by yet another 10 percent. So for a man who weighs 72 kg and is 55 years of age, the estimated Ironman power range would be approximately 188 to 214 watts (72kg x 2.9-3.3 = 209-238w, subtract 10% for 20 years of age = 188-214w). A woman of the same age who weighs 60 kg (132 lbs) may subtract another 10 percent for a ballpark range of 141 to 160 watts.

Now realize that these really are just ballpark estimates and not carved-in-stone, scientifically proven facts that everyone must abide by. It’s merely intended to give you a starting point for determining what your average power should be for the bike portion of an Ironman. Some will find the range too low and for others it will be too high. Extreme heat (as in Hawaii) must also be taken into consideration. Learning to apply all of this is one of the reasons that you train—to narrow down what your targeted power should be.

Most athletes I talk with don’t do this at all. They train using heart rate and assume that will give them the best possible bike split. Whenever you are seeking a specific output (bike split) you should measure output (power) not input (heart rate). Heart rate tells you how hard you’re working (plus a lot of other stuff such as what you had to eat or drink and the weather) while power tells you what you’re accomplishing. This is not to say that heart rate is not valuable information during a race. It is. But it must be compared with power (or pace on the run) to be meaningful. This is another completely different post I’ll do some day.

Labels: , , , ,