Training Tools
In 1995 I tried using a power meter for the first time--an SRM the company loaned me for the summer while I was writing The Cyclist's Training Bible. It began to change the way I saw the process of training for bike racing and triathlon. Then in 1998 Tune, Inc. which created and sold the Power-Tap power meter gave me a prototype to use. I've been using them ever since and now require that everyone I coach also have a power meter. The heart rate monitor, while a useful tool in itself, is now an even a better tool. The combination of power and heart allows me to prescribe workouts and analyze their results in very precise ways. I don't know how I coached athletes before the power meter came along. I suppose it was all just guesswork although it seemed quite effective at the time.
Now something else has come down the pike that is once again modifying how I view and understand training -- WKO+ software (formerly known as Cycling Peaks). I started using it for myself and the athletes I coach last fall. Designed by Andy Coggan and Hunter Allen, this makes the power and heart rate tools even more effective. It took me a while to figure out, but once again I am beginning to see training in a slightly clearer way. Based on metrics called "Training Stress Score" (TSS) and "Intensity Factor" (IF) which are derived from power meter data, the software produces and updates daily how your training is going. (I won't go into the math of TSS, IF, etc here. Buy Coggan's and Allen's book, Training and Racing With a Power Meter for all the gory details.)
Let me give a small example of how my view of training is being refined and better defined because of WKO+.
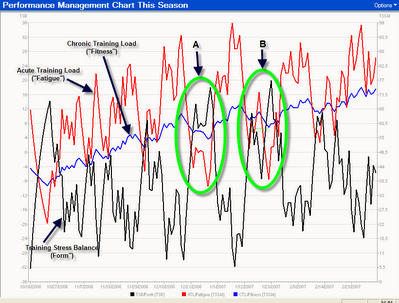
Above is a screen shot of an athlete's "Performance Manager Chart" from WKO+. The red line represents fatigue, the blue line fitness and the black line form (race readiness). To paraphrase a basic concept from Andy Coggan, form = fitness - fatigue. This simply means that if you want to be race ready (rising black line) you need to first build fitness (rising blue line) by being very consistent with your training and then reduce fatigue (red) by allowing for rest. You can see this happening in the above chart. Fitness ratchets upward for several weeks as the athlete trains fairly consistently. Several times throughout this four-month snapshot fatigue is shed. You can see this as a drop in the red line. The athlete is resting by reducing training stress through less intensity, less frequency, less duration or some combination of these. As fatigue is reduced, form rises. The athlete is becoming race ready. Very simple to see.
But there are some less obvious nuances. For example, notice in circle "A" that fatigue drops and form rises. The athlete is becoming race ready. But also notice that fitness is dropping at the same time. Whenever training stress is reduced to eliminate fatigue, fitness also begins a slow decline. Basically, the same thing is happening with circle B--fatigue is down, form is up and fitness is dropping slightly. Even though form appears to be about the same level in both circles, notice that fitness drops more in circle A. In fact, the athlete reported not feeling very sharp at the form high point in A, but reported feeling quite strong at circle B's high form point. Obviously, because not as much fitness was lost.
So what does this mean? For years I have been tapering athletes in the Peak period by having them do a race effort workout every 72 hours with two active recovery days between. This has usually worked well. Circle B reflects that training method. Essentially, circle A had too many days of active recovery between the hard workouts. So because of the software now I can now see a representation of what I figured out many years ago and I can actually manage the day the athlete comes into high form. Pretty remarkable.
Stay tuned as I'm told there are even more remarkable features being designed for the software. It's becoming more fun all the time.
Labels: bike training, cycling peaks, performance manager chart, training bible, wko+
posted by Joe Friel @ 7:18 PM
11 Comments
![]()
![]()